Nov 18th – Join WRI and IDB for Webinar on Informal and Semiformal Public Transport Services!
13 November 2020
Virtual Chat With Trufi Association
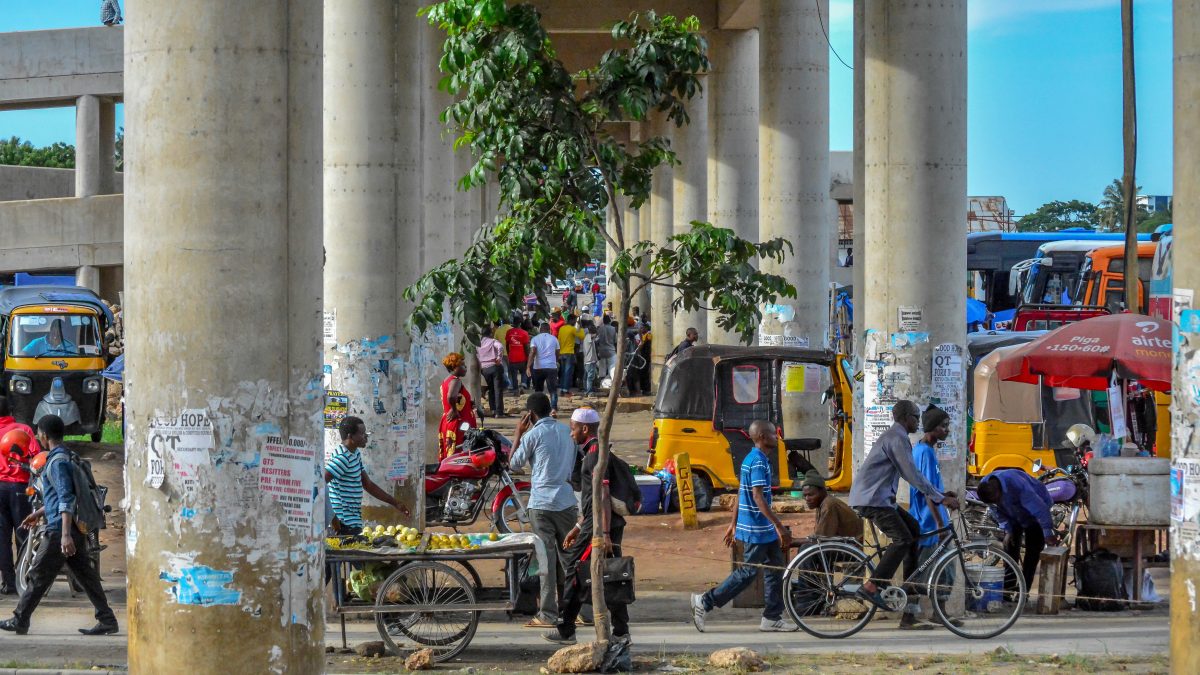
14 December 2020People walking in Dar es Salaam. Photo by ITDP-Africa
Pedestrians First is a new set of tools to measure walkability in any city on earth. These tools are powered by the digital commons, including data like the types found on DigitalTransport4Africa. They’re particularly meant for city planners and designers, but they’re user-friendly for everyone, including academics, journalists, neighborhood advocates, politicians, and interested citizens. Pedestrians First is especially useful in African cities, and it can help you make your city more walkable, sustainable, and equitable.
Register for upcoming webinar
On Thursday, December 10th, ITDP will be hosting a free, public webinar explaining how to use Pedestrians First to make your city more walkable.
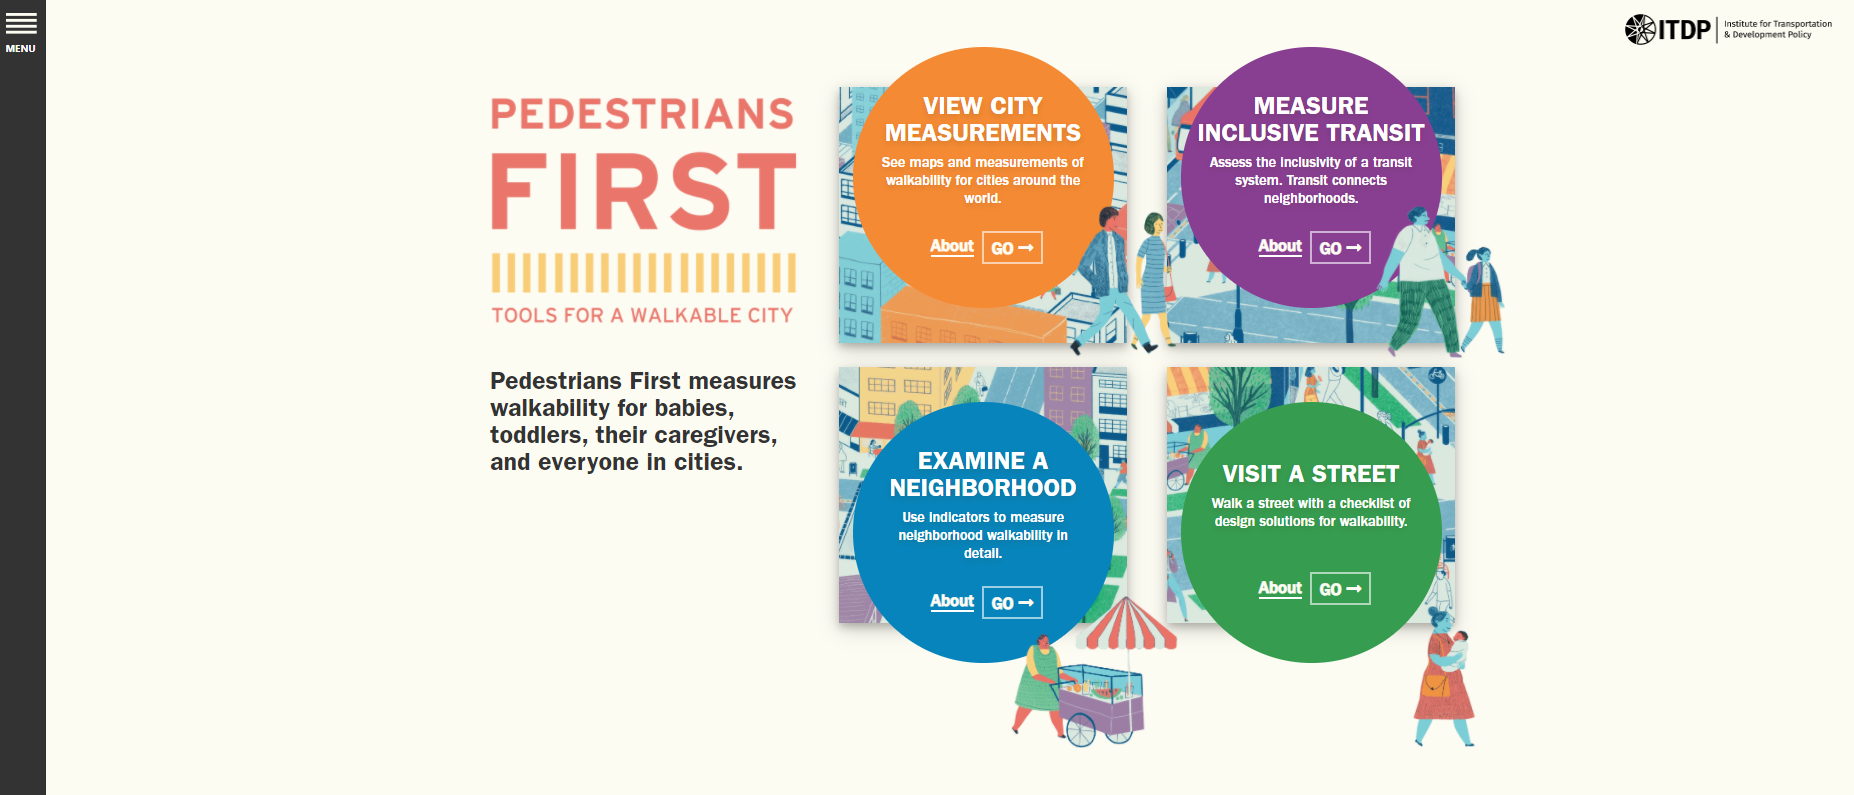
Pedestrians First is a website that anyone can use.
Walking is the most fundamental mode of transport for everyone, and it’s the most common mode of travel in many cities in Africa. Walking is good for a city in lots of ways: it’s good for public health, it’s good for the economy, it’s good for equity, it reduces pollution compared to motorized modes, and it’s even good for resilience to crises like COVID-19 as it improves physical health and reduces health-adverse air pollution. One study by C40 found that walking just 30 minutes a day could reduce the risk of heart disease and stroke by almost 25%.
But even though walking is important, beneficial, and very common, it’s often ignored by urban planners in African cities. Governments often make African cities less walkable, less sustainable, and less equitable by prioritizing cars over people walking. It’s a recipe that leads to tragic loss of life due to traffic collisions. In 2016, there were an average of 27 road deaths per 100,000 residents in Sub-Saharan Africa, which is a third higher than the global average. In fact, 90% of global road deaths occur in low- and middle-income countries. Urban pedestrians are especially vulnerable. Between 2010 and 2015, pedestrians accounted for 88% of road fatalities in Addis Ababa.
It’s time to build African cities for people, not just for cars. It’s time to put pedestrians first.
But it’s challenging to build walkable cities. Walkability doesn’t happen automatically. It must be planned, designed, and funded. Walkability is a lot more than just sidewalks – it’s a complicated phenomenon, influenced by small details like curb heights and street trees as well as city-wide planning like street networks and zoning. Pedestrians First is a new set of tools to help cities understand what matters most to improve walkability. With these tools, planners can know what their city has and what it needs – and knowing, as a famous soldier once said, is half the battle.
Because walkability is so complicated, Pedestrians First is divided into four different tools for different scales of analysis. They measure walkability for streets, neighborhoods, transit systems, and entire cities. You can use all four of them, or you can decide which one you want to use for a particular planning project.
Walking the Streets
Visit A Street helps you walk down any street, filling out a checklist of questions that help you understand the strengths and weaknesses of walkability there. It’ll point out the details that make a street comfortable or uncomfortable, safe or unsafe, for walking. As you fill out the checklist, you’ll also see policy recommendations to help you fix problems with walkability in your city.
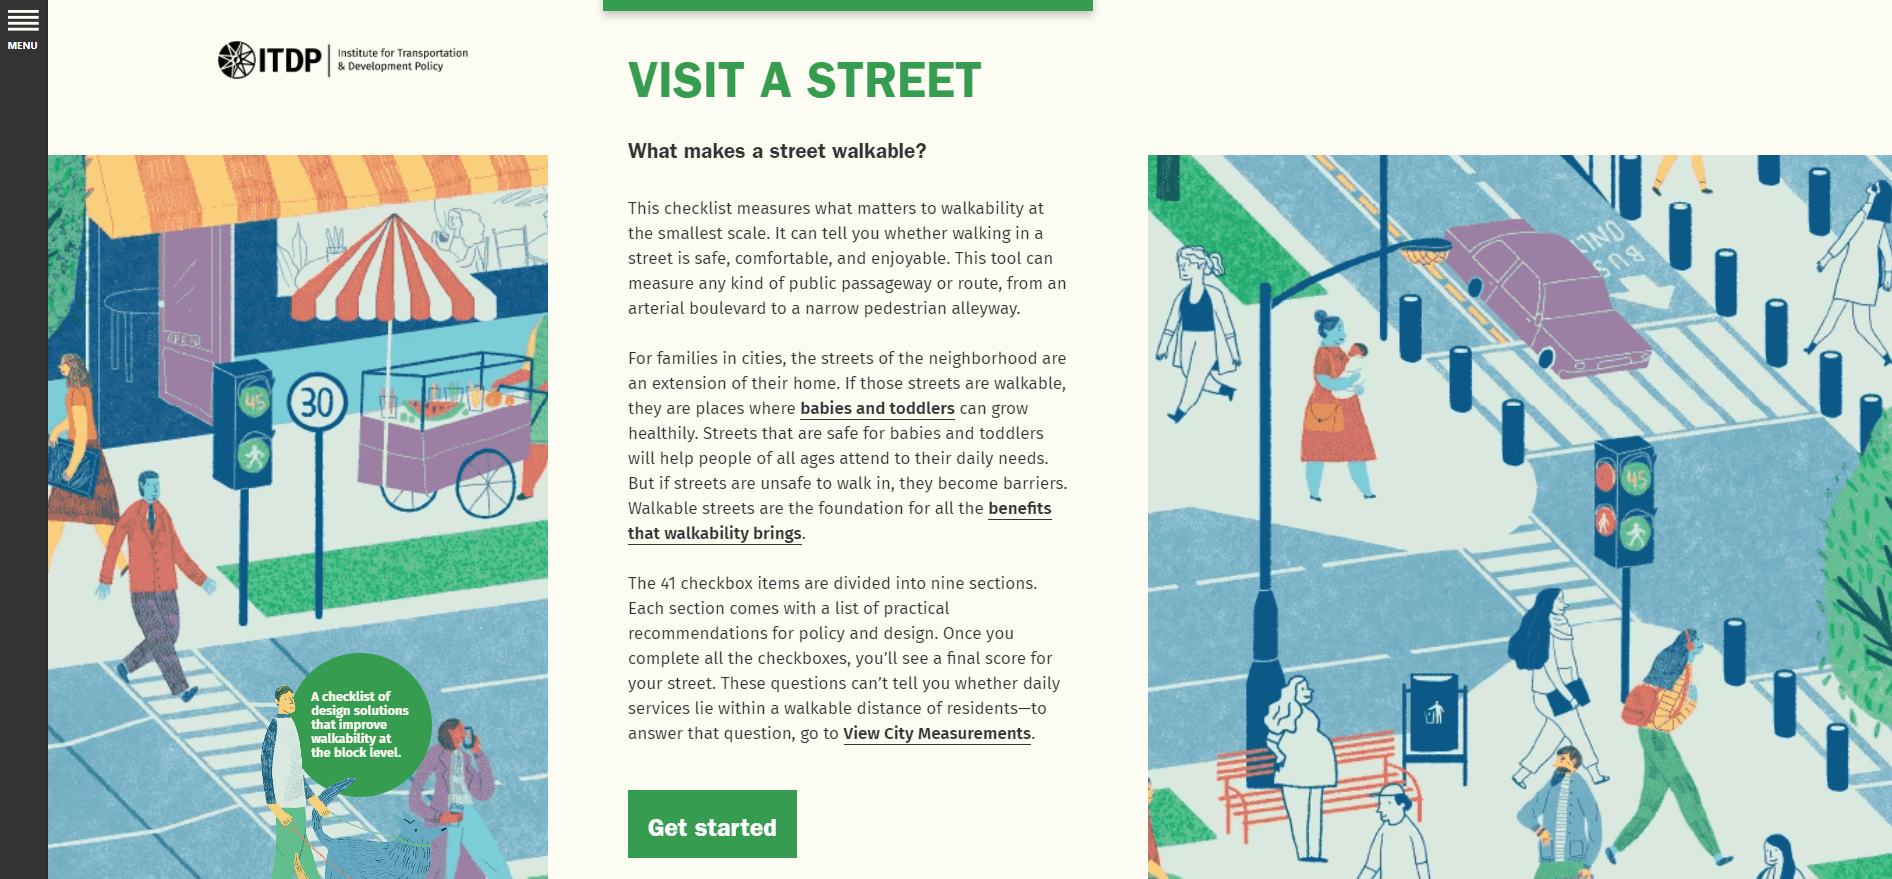
The Visit A Street tool can be used on desktop or on mobile devices.
Welcome to the Neighborhood
Examine A Neighborhood zooms out to ask you questions that measure walkability for a whole neighborhood all at once. It captures some things that are too big to measure for an individual street – like the way that a mix of different kinds of businesses, services, and residences come together to form a 15-minute neighborhood. But it doesn’t measure some of the details that you find in Visit A Street. Examine A Neighborhood also shares examples that illustrate pedestrian-friendly neighborhood planning from around the world.
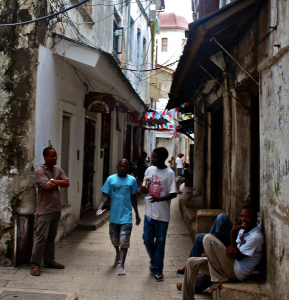
Examine A Neighborhood uses Stone Town, Zanzibar, Tanzania, as a worldwide best practice example of how pedestrian shelter from local weather can come from narrow streets and vertical buildings with small overhangs.
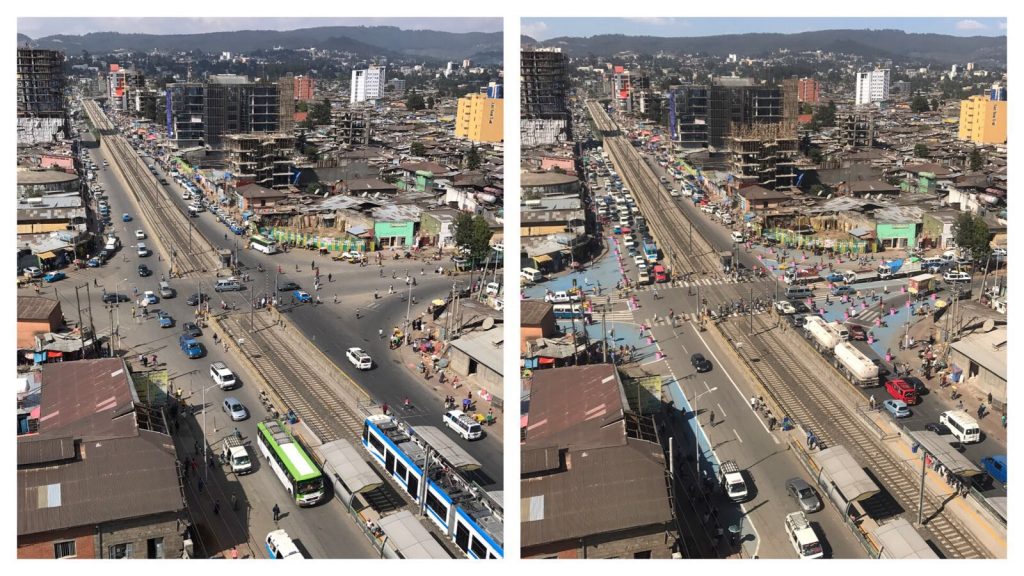
Examine A Neighborhood also highlights the temporary redesign of the Sebategna intersection in Addis Ababa. This redesign created a safe, pedestrian-friendly, and visually engaging space for people on the street. The redesign narrowed lanes, expanded walkways, tightened corners, closed slip lanes, and added pedestrian refuge islands.
Integrate with Transit
Measure Inclusive Transit is a supplementary tool, helping you understand how your city’s transit system supports the most vulnerable residents. It identifies several of the ways that a transit system can include or exclude, benefit or harm, members of marginalized communities. For example, a system that makes it easier to travel long distances at peak hours but more difficult to shop for food or visit a clinic is a system that benefits working commuters (disproportionately men) over caregivers (disproportionately women).
Transit is included in a tool dedicated to walkability because transit connects walkable neighborhoods. After all, everyone’s transit trip starts and ends by walking. A public transit system transforms a collection of walkable neighborhoods into a single walkable city. But transit that is expensive, polluting, or non-inclusive of marginalized people will not be effective in connecting walkable neighborhoods.
Measure Up Your City
View City Measurements is the easiest tool to use. It gives you a birds-eye-view on how walkable your entire city is. Unlike the other three tools, it doesn’t make you answer questions to get a measurement – it’s already loaded with maps and statistics of five indicators of walkability for nearly 1,000 urban areas around the world. These maps can help you see where your city is already walkable, and where more effort is needed.
However, you shouldn’t only use View City Measurements by itself and think you fully understand walkability. It doesn’t measure the smaller-scale details that really matter for walkability – like the quality of sidewalks or the speeds of cars. View City Measurements is a starting point, not a comprehensive study.
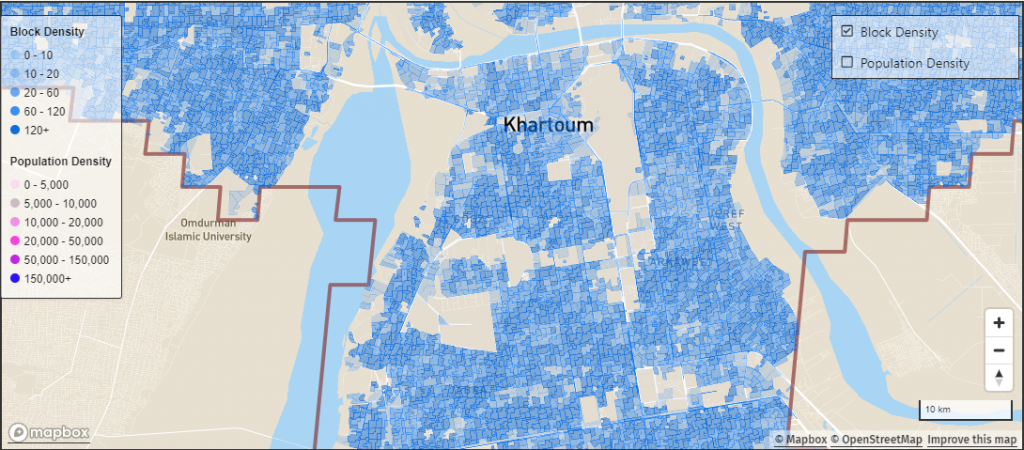
View City Measurements shows that Khartoum, Sudan, has 132 city blocks per square kilometer – one of the highest, most walkable block densities in the world.
Creating an Open Data Commons for Walkability
View City Measurements makes Pedestrians First the first-ever worldwide database of walkability statistics. This database relies entirely on the open data commons – especially on OpenStreetMap, but also public transport from OpenMobilityData.org. Without efforts like these, and like DigitalTransport4Africa, Pedestrians First wouldn’t be as useful. Because of the open data commons, ITDP didn’t have to build 1,000 tools to measure walkability in 1,000 cities — we only had to build one.
Pedestrians First also contributes to the open data commons: the full dataset is available for download, and so is the geospatial data for any particular measurement. Data files can be found on the ‘review’ page of the View City Measurements tool.
Pedestrians First illustrates an important opportunity and challenge of the open data commons: the coordinated analysis of data from many uncoordinated cities. Because OpenStreetMap and OpenMobilityData are global in scope while using unified standards for data formats and data quality, Pedestrians First is able to gather data from them and use it to compare cities – all the way from Rio de Janeiro to Nairobi to Jakarta to Tokyo. DigitalTransport4Africa is a more general repository of data, welcoming a variety of formats as long as they are tagged with appropriate metadata that makes them locally useful. This means that DT4A can be more sensitive to local conditions. But it also means that DT4A is less amenable to the kind of large-scale comparative analyses that Pedestrians First relies on. This may be a tension, but it is not necessarily a problem. Pedestrians First and projects like it can complement the efforts of DigitalTransport4Africa as we work together to build urban mobility that is safe, equitable, and integrated.
